

Monitoring
Uptime monitoring and status pages
Turn on uptime checks, choose how often they run, send down and recovery alerts by email, Slack or webhook, and share a public status page for each site.
Applies to: Paid plans
Uptime monitoring checks each site's address on a schedule and tells you when it stops answering, and again when it comes back. It is part of the paid plans; on the free plan the Uptime tab explains it and links to the plans. Status pages work on every plan.
Turn it on
- Open the site and go to Settings.
- Under Monitoring & Status, switch on Enable Uptime Monitoring.
- Choose a Check Interval: every 1, 2, 5, 10, 15, 30 or 60 minutes. New sites start at 10 minutes.
- Click Save Monitoring Settings.
What a check does
Each check requests the site's address, follows up to five redirects and waits up to 10 seconds. A 2xx answer counts as up. A 503 counts as up only when it is WordPress's own maintenance page, which it shows while it updates. Any other answer, a timeout or a redirect loop counts as down.
When a check fails, the site is checked again about a minute later. If that fails too, probes in Europe, North America and Asia check it, and the site counts as down when at least two of them get no answer or a server error. Sites behind basic authentication are re-checked from our servers only. If the probes themselves cannot be reached, the two failed checks from our servers decide.
Where alerts go
Down and recovery alerts go out at once, through the channels you chose for Uptime (down and recovered) in the Alerts Centre: email, Slack or both, for all sites or the ones you pick.
To send one site's alerts somewhere else, open its Uptime tab, go to Alert Configuration and click Add Alert. Pick Email, Webhook or Slack and enter the address. A new email address gets a verification email first. Each target can be switched On or Off and has a Send test alert button. A site with its own targets uses them instead of the Alerts Centre.
You get one down alert per outage, at least five minutes apart for a site, and a recovery alert only after a down alert. Targets on the Uptime tab also get a Slow Response alert when recent response times run at more than twice the site's seven-day average.
A webhook receives JSON with event set to site.down or site.recovered, plus the site, the check and the incident.
Read the Uptime tab
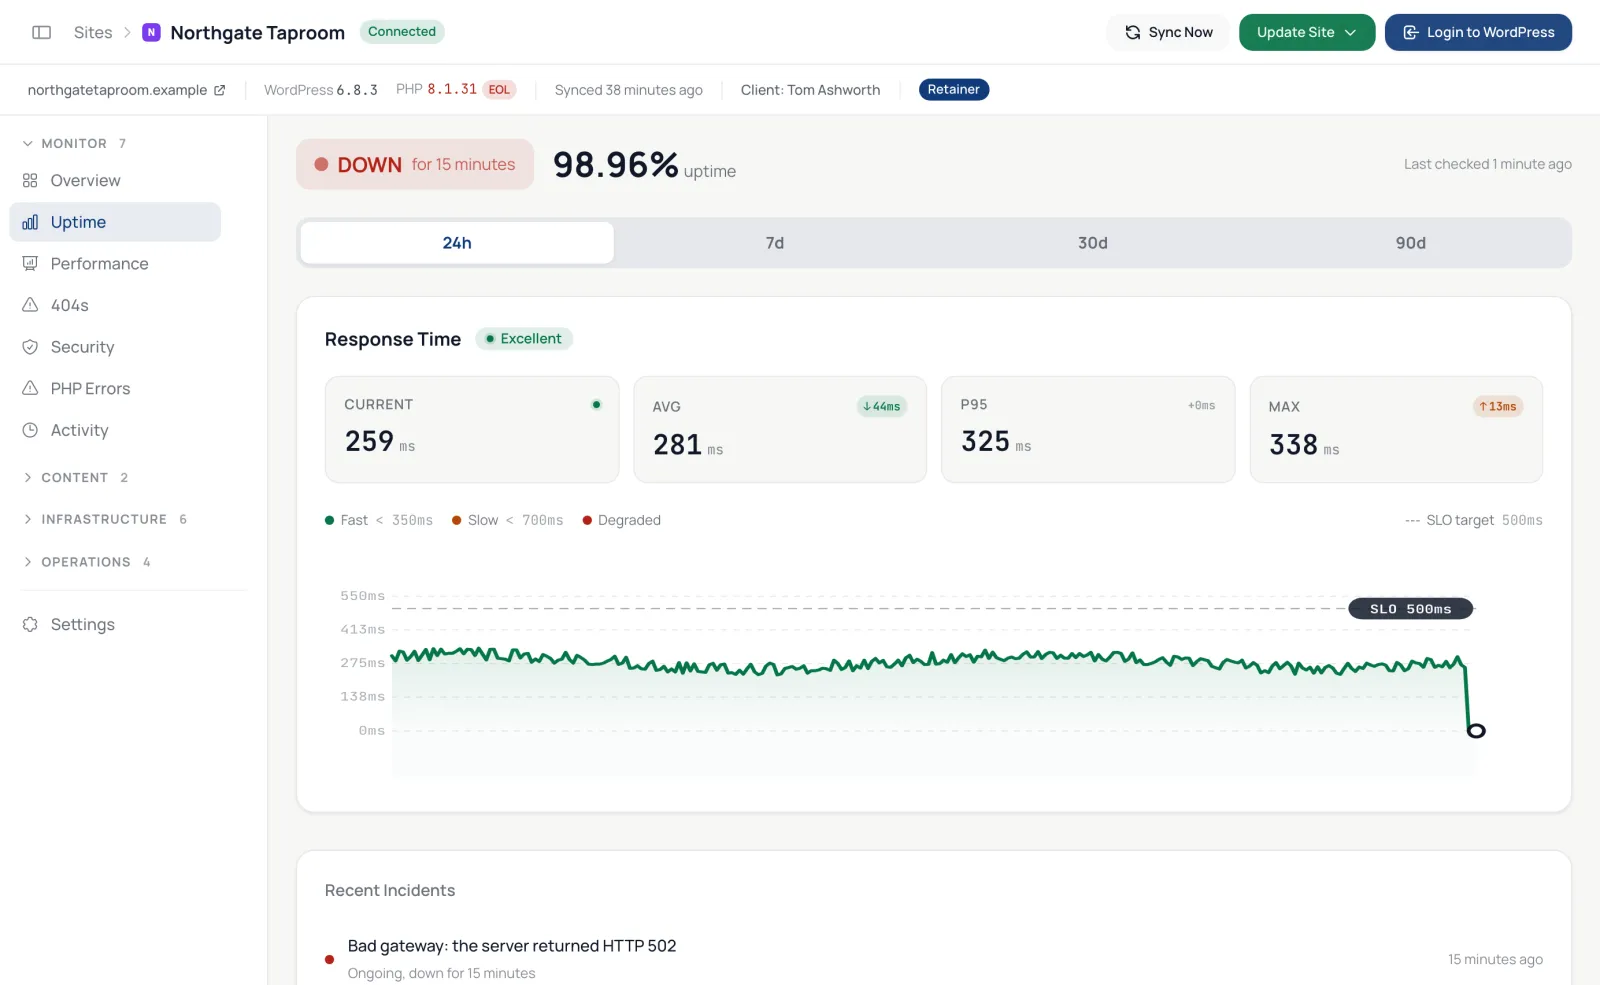
Choose 24h, 7d, 30d or 90d. The tab shows uptime for that period and response times (current, average, 95th percentile and maximum) against a 500 ms target line. Recent Incidents lists each outage with its cause and how long it lasted (or, while it lasts, how long so far). Raw checks are kept for 90 days.
Share a status page
Every site can have a public status page, on any plan.
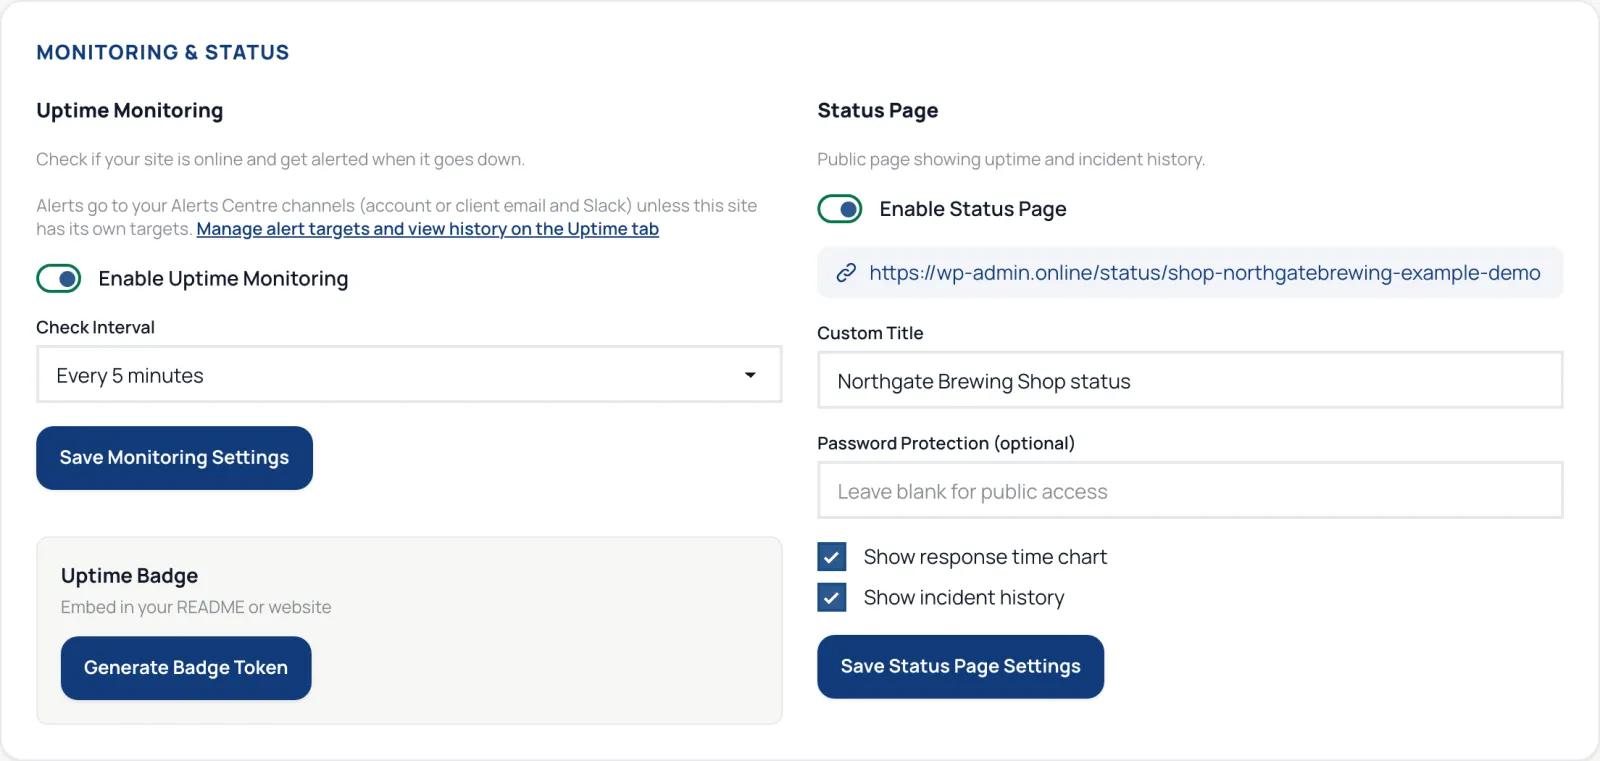
- Open the site and go to Settings.
- Under Status Page, switch on Enable Status Page.
- Optionally set a Custom Title, a password under Password Protection (optional), and choose Show response time chart and Show incident history.
- Click Save Status Page Settings. The page's address appears below the switch.
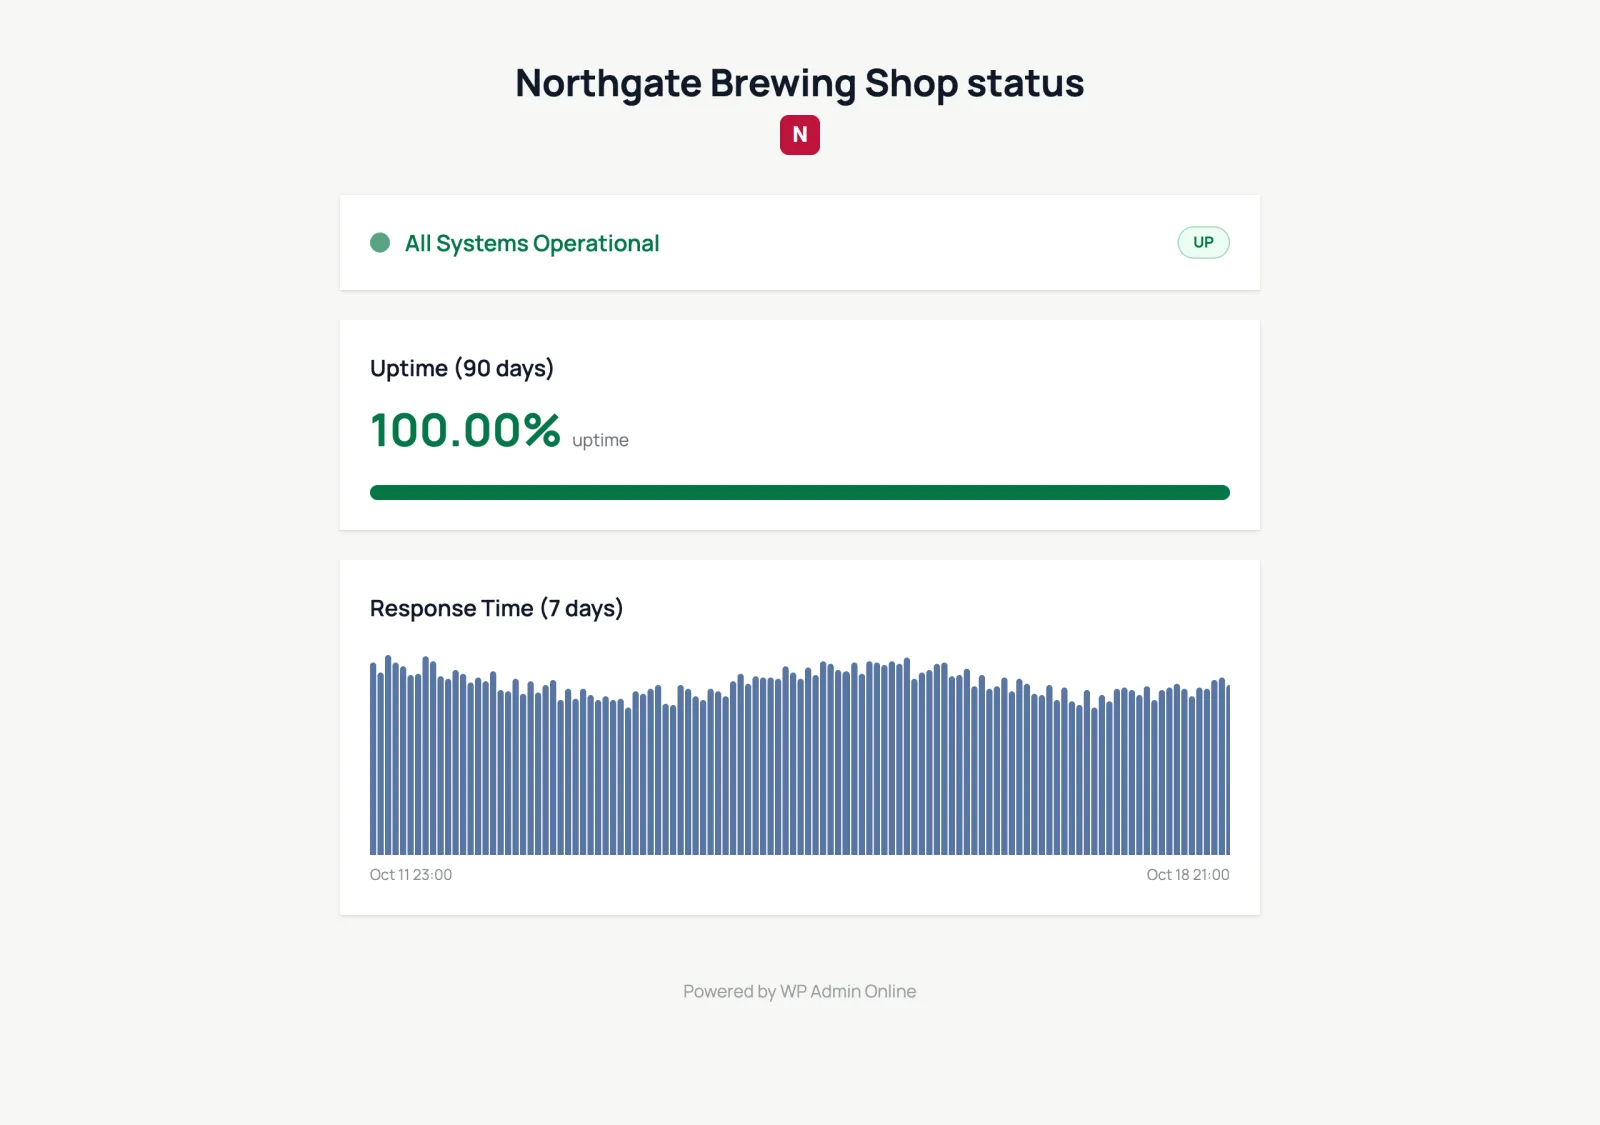
The page shows the current status, uptime for the last 90 days, response times for the last 7 days and recent incidents, refreshed every five minutes. Uptime figures appear only while uptime monitoring runs; until then the page says the site is not monitored.
Pause checks
Uptime checks do not pause for maintenance windows. To stop them for a while, use Pause Site, which pauses all background work for that site, or switch monitoring off.
Uptime badge
On paid plans, Generate Badge Token gives you an image of the site's 30-day uptime to put on a client page.
Product overview: Uptime monitoring